The Dashboard Illusion: Why Your Security KPIs May Be Measuring the Wrong Things
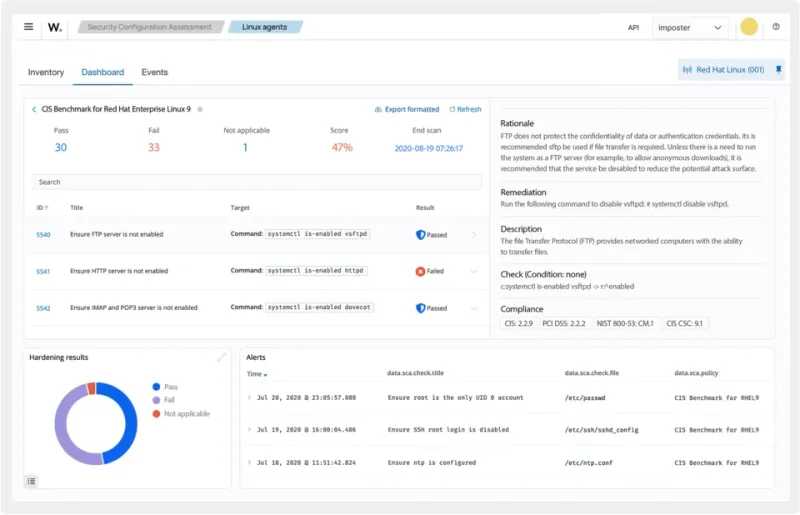
Photo: Wazuh, Inc., GPLv2, via Wikimedia Commons
There is a particular kind of organizational comfort that comes from a well-populated security dashboard. Green indicators, declining incident counts, high patch completion rates, and training completion percentages near one hundred — the visual language of these reports communicates control and competence. Boards feel reassured. Executives feel accountable. Security teams feel validated.
The problem is that a significant portion of what appears on those dashboards may have very little relationship to whether the organization is actually becoming harder to compromise.
This is not a peripheral concern. When enterprise leaders make resourcing decisions, vendor selections, and risk acceptance judgments based on metrics that do not accurately represent security posture, the consequences can be severe — and they tend to surface at the worst possible time.
Why Misleading Metrics Persist
Before examining specific problematic indicators, it is worth understanding why they became standard in the first place. Most popular security metrics emerged from a compliance-driven environment where the primary objective was demonstrating adherence to a defined control framework. Metrics that mapped cleanly to audit requirements — training completion, policy acknowledgment rates, mean time to patch — were adopted because they were easy to collect, easy to report, and satisfying to auditors.
Over time, these compliance-oriented measurements migrated into operational security dashboards without being critically re-evaluated for whether they actually correlate with reduced risk. They have become institutionalized not because they are the most informative signals available, but because they are the most familiar.
The result is a reporting infrastructure that, in many enterprises, optimizes for the appearance of a well-managed program rather than the substance of one.
Metrics That Frequently Mislead
Patch completion rate is perhaps the most widely cited security metric in enterprise environments, and it is one of the most easily misread. A ninety-five percent patch rate sounds impressive. But if the remaining five percent of unpatched systems includes the legacy application processing financial transactions, the OT environment controlling physical access, or the server hosting the most sensitive customer data, that number is deeply misleading. Aggregate patch rates obscure criticality. What matters is not how many systems are patched, but whether the systems most likely to be targeted are protected.
Security training completion rates present a similar problem. An organization reporting ninety-eight percent annual training completion has demonstrated that nearly all employees clicked through a module and passed a quiz. It has not demonstrated that those employees can recognize a sophisticated phishing attempt, that they understand their specific responsibilities during an incident, or that training has changed their actual behavior in any measurable way. Completion is an input. Behavioral change is the output — and very few enterprises track the latter.
Mean time to detect (MTTD) and mean time to respond (MTTR) are more operationally meaningful than the metrics above, but they can still mislead when they are calculated across all incidents without distinguishing severity. An organization that detects and closes hundreds of low-severity alerts quickly while taking weeks to identify a persistent threat actor operating in a higher-privilege environment will report impressive aggregate MTTD and MTTR numbers. The averages hide the cases that matter most.
Number of blocked threats is a metric that appears on many security operations dashboards and reliably produces large, reassuring numbers. Firewall blocks, endpoint detections, and email filtering hits accumulate rapidly. But volume of blocked commodity threats says very little about the organization's ability to detect and contain the targeted, low-and-slow intrusion attempts that characterize sophisticated adversaries. High block counts can actually create complacency by generating a sense that the perimeter is actively defending against a constant siege — when the more consequential risks may be arriving through entirely different vectors.
Vulnerability count trends — specifically, reporting a declining number of open vulnerabilities over time — can be manipulated, intentionally or otherwise, by adjusting how vulnerabilities are categorized, aged out, or accepted as risks. A reduction in reported vulnerability counts does not necessarily reflect a reduction in actual exposure.
What More Useful Measurement Looks Like
Shifting toward metrics that genuinely inform risk decisions requires measuring outcomes rather than activities, and adversarial conditions rather than administrative compliance.
Assumed breach detection rates — derived from red team exercises or purple team engagements — measure whether the security operations team can identify simulated adversary behavior when it is deliberately introduced into the environment. This is a far more meaningful signal than the number of commodity threats blocked by automated tools.
Critical asset coverage tracks what percentage of the organization's most sensitive systems and data repositories are under active monitoring, with defined detection logic and response playbooks. This metric forces prioritization and exposes the gaps that aggregate metrics conceal.
Control effectiveness under realistic conditions can be assessed through regular tabletop exercises and technical testing that evaluates whether documented controls perform as intended when someone is actively attempting to circumvent them — not just when they are being reviewed for compliance purposes.
Dwell time for confirmed incidents — how long a threat actor or unauthorized process was present in the environment before detection — is a sobering and revealing measurement. Organizations that track this metric honestly often discover that their detection capabilities are significantly weaker than their MTTD dashboards suggest.
Privileged access hygiene indicators — including the number of dormant privileged accounts, the percentage of privileged sessions subject to session recording, and the frequency of access reviews for high-risk roles — provide a more direct view of one of the most commonly exploited attack surfaces in enterprise environments.
Changing the Conversation at the Leadership Level
Perhaps the most important dimension of this problem is not technical — it is organizational. Security metrics are ultimately a communication tool, and the metrics that appear on executive dashboards reflect implicit decisions about what leadership is prepared to hear and act on.
Boards and executive teams that have grown accustomed to the comfort of green dashboards may be resistant, initially, to metrics that reveal genuine exposure. Reframing this as a risk management discipline rather than a criticism of the security team is essential. The goal is not to generate alarm but to ensure that the signals informing consequential decisions are accurate.
At Select Real Security, we work with enterprise clients to distinguish between measurement that satisfies reporting requirements and measurement that actually drives better security outcomes. The difference between those two things is not always visible on a dashboard — but it becomes visible when a real threat arrives.